Technical analysis is the study of price movement on charts. Traders use it to understand market behavior, identify important levels, and prepare possible trade scenarios. It does not predict the future perfectly, but it helps traders build structure.
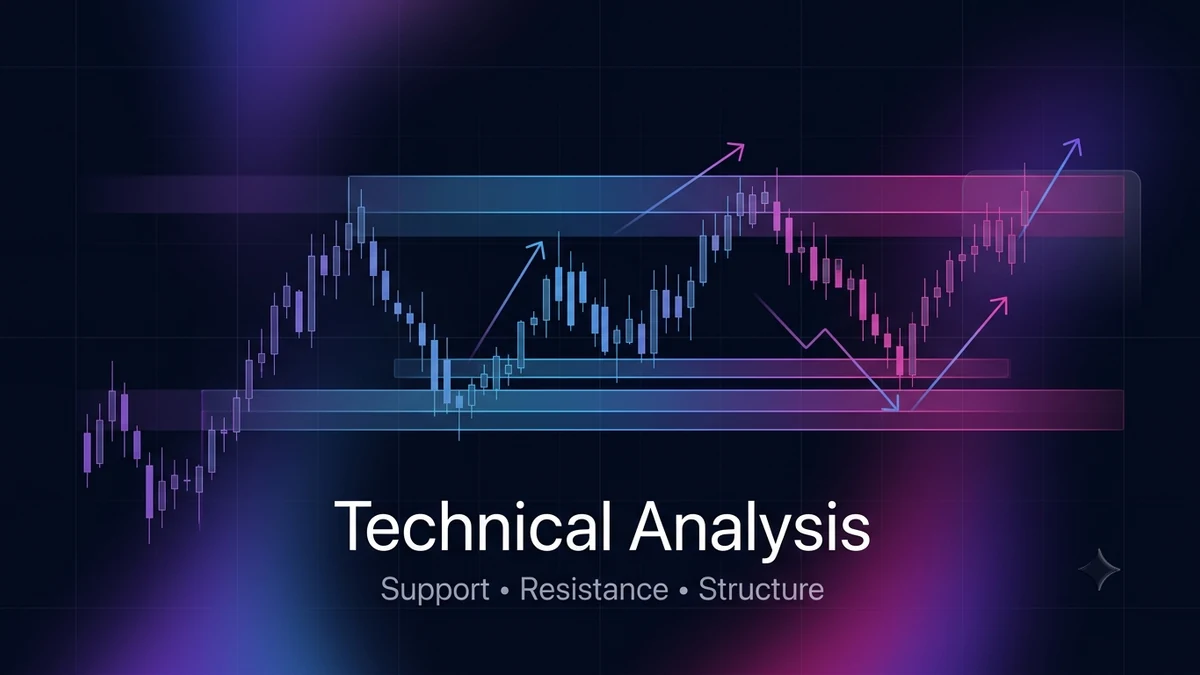
Support is a price area where buyers have previously been active. Resistance is a price area where sellers have previously been active. These levels matter because markets often react around areas where traders made decisions before.
Market structure shows how price is moving. In an uptrend, price often creates higher highs and higher lows. In a downtrend, price often creates lower highs and lower lows. When structure changes, it can signal that market conditions may be shifting.
Traders also look at momentum, candles, liquidity, trendlines, and moving averages. However, the most important skill is understanding context. A support level in a strong downtrend may not hold. A resistance level during strong bullish momentum may break.
Technical analysis works best when combined with risk management. A setup should include a reason for entry, a level where the idea becomes invalid, and a target area. Without risk control, even good analysis can lead to poor results.
Beginners should avoid adding too many indicators. It is better to master simple concepts first: trend, support, resistance, structure, and risk. Clarity is more valuable than complexity.